Am I the only one that has become totally fed up with politics as usual? No matter what side you are on, you have to be tired of politicians banking on the ignorance of their constituents. The conservatives are pushing their agenda and putting their particular spin on the facts. The liberals aren’t any better, they just simply have a different point of view. How in the world can one fact have such polarity in the way that it is presented? This happens when the truth is discarded for political expediency.
With all the talk going around country about the impact that the Obama Administration has had on the economy, I decided to take a look myself. I look for non biased reports that supplied the factsand nothing else. When you remove the political agendas and positional strategies, you can gain a more lucid and accurate understanding of what has been or has not been accomplished by the Obama Administration since he was initially elected into office.
Take a look at the summary of one of the reports that I uncovered. These are the numbers, but based on which political perspective you listen to, the views expressed will be different.
A scorecard on the economy under Barack Obama
Share this article:

See how the economy has changed since Obama was elected in 2008.
In the hotly contested presidential campaign between President
Barack Obama and
Mitt Romney there is one undisputed point: the central issue is the state of the American
economy.
End of agreement.
Were the country’s economic troubles deeper than expected when Obama took office in January 2009? Were his ideas and actions effective in righting the nation’s economic ship? Are things getting better? If so, are they getting better fast enough?
From both parties, the political rhetoric will be contentious for the next five months and, by its very nature, oversimplified. But below the fury there are objective metrics as to how the economy has performed on Obama’s watch and where it stands today.
PolitiFact.com, the independent fact-checking operation of the
Tampa Bay Times, has produced a scorecard — key economic measures to track where the economy stood a year before Obama took office, where it was when he assumed power and how it has trended through May 2012.
We’ve gathered statistics for everything from corporate profits to the price of ground chuck. To help you see which ones are up or down, we’ve shaded most of the statistics from white (the most positive number) to dark (the least positive). We offer figures for 2008, 2009, 2010, 2011 and 2012 — either an annual figure for the whole year or the monthly figure for January of that year. We also added a column for the most recent figures available.
Some analysis suggests the mixed record that most Americans feel:
• Gasoline prices, the rate of poverty,
food stamp use and the federal debt are worse today than when the president took office.
• The unemployment rate, personal income and the stock market turned worse but are improving.
But the point of the scorecard is for you, the voters and consumers of political speech, to have factual measures by which to judge what you hear. The perspective you bring to it is all yours.
About these charts
To help you see how the numbers trend, we’ve shaded the statistics from white (the most positive number) to dark (the least positive). We haven’t shaded the numbers for government jobs because of differing opinions over whether more government employment is helpful to the economy.
Income
|
2008 |
2009 |
2010 |
2011 |
January
2012 |
April/May
2012 |
| Yearly GDP |
$13.2 T |
$12.7 T |
$13.1 T |
$13.3 T |
— |
$13.5 T |
| Disposable personal income per capita |
$33,229 |
$32,166 |
$32,481 |
$32,667 |
— |
$32,677 |
| Personal bankruptcies |
1,074,225 |
1,412,838 |
1,536,799 |
1,362,847 |
— |
— |
| Poverty rate |
12.5% |
13.2% |
14.3% |
15.1% |
— |
— |
| People receiving food stamps |
— |
32 M |
39 M |
44 M |
46 M |
46 M |
Homes
|
2008 |
2009 |
2010 |
2011 |
January
2012 |
April/May
2012 |
| Median home sale price |
$232,400 |
$208,600 |
$218,200 |
$240,100 |
$221,700 |
$235,700 |
| New homes sold in that month |
44,000 |
24,000 |
24,000 |
21,000 |
23,000 |
33,000 |
| Existing home sales, annualized |
4.2 M |
3.8 M |
4.2 M |
4.5 M |
4.6 M |
4.6 M |
| Foreclosure starts |
0.88% |
1.08% |
1.2% |
1.27% |
0.99% |
0.96% |
Business
|
2008 |
2009 |
2010 |
2011 |
January
2012 |
April/May
2012 |
| Corporate profits |
$1.2 T |
$1.4 T |
$1.8 T |
$1.9 T |
— |
— |
| Bank failures |
25 |
140 |
157 |
92 |
61 |
— |
| Corporate bankruptcies |
43,546 |
60,837 |
56,282 |
47,806 |
— |
— |
| Industrial production |
100.4 |
87.4 |
87.4 |
92.5 |
96.5 |
97.4 |
| Consumer confidence |
87.3 |
37.4 |
56.5 |
64.8 |
61.5 |
64.9 |
| Dow Jones Industrial Average |
13,044 |
9,035 |
10,584 |
11,671 |
12,397 |
12,393 |
| Labor productivity |
103 |
103 |
109 |
110 |
111 |
— |
Footnotes
M indicates million and T indicates trillion.
Unemployment rate Unemployment rate for the civilian labor force, seasonally adjusted.
Bureau of Labor Statistics. Monthly rate shown.
Broader unemployment rate “U-6” A broader unemployment measure than the basic unemployment rate. Includes total unemployed, plus all persons marginally attached to the labor force, plus total employed part time for economic reasons, as a percent of the civilian labor force plus all persons marginally attached to the labor force, seasonally adjusted.
Bureau of Labor Statistics. Monthly rate shown.
White unemployment Unemployment rate for the civilian labor force, seasonally adjusted, for whites.
Bureau of Labor Statistics. Monthly rate shown.
Black unemployment Unemployment rate for the civilian labor force, seasonally adjusted, for blacks or African Americans.
Bureau of Labor Statistics. Monthly rate shown.
Hispanic unemployment Unemployment rate for the civilian labor force, seasonally adjusted, for Hispanics or latinos.
Bureau of Labor Statistics. Monthly rate shown.
Total government jobs Total government jobs (federal, state, local), seasonally adjusted.
Bureau of Labor Statistics. Monthly rate shown.
Median weeks unemployed Median weeks unemployed, 16 and older, seasonally adjusted.
Bureau of Labor Statistics. Monthly rate shown.
Yearly gross domestic product Real gross gomestic product, seasonally adjusted and inflation adjusted (table 1.5.6). GDP means the value of all finished goods and services produced within a country’s borders during a year.
Bureau of Economic Analysis. 2008-2011 are annual amounts, 2012 is 1st quarter at an annual rate.
Disposable personal income per capita Disposable personal income is defined as personal income (including employment compensation, proprietor and rental income, interest and dividends, and government transfer payments) minus taxes and payments for social insurance programs. Measure is inflation-adjusted (table 2.1).
Bureau of Economic Analysis. 2008-2011 are annual amounts, 2012 is 1st quarter at an annual rate.
Poverty rate Percent of all people below poverty level. Poverty levels vary by year, and by such factors as size of family, number of adults and children in a household and the age of adults in the household. For a family of two adults and one child, for instance, the Census Bureau’s poverty threshold is $18,106.
Census Bureau. Annual rate shown.
People receiving food stamps Persons participating in Supplemental Nutrition Assistance Program.
Agriculture Department. Monthly figures shown for January of each year, except for final column, which is February.
Median home sale price Median sales prices of new homes sold in the United States.
Census Bureau. Monthly figures shown for January of each year, except for final column, which is April.
New homes sold in that month New homes sold in the United States, not seasonally adjusted.
Census Bureau. Monthly figures shown for January of each year, except for final column, which is April.
Existing home sales, annualized Existing home sales. Courtesy National Association of Realtors. Monthly figures at an annualized rate.
Foreclosure starts Mortgage foreclosure starts as a percentage of loans outstanding. Courtesy Mortgage Bankers Association. Figures are for fourth quarter of prior year, except final column, which is first quarter of 2012.
Corporate profits Corporate profits with inventory valuation and capital consumption adjustments.
Bureau of Economic Analysis. Annual amounts.
Bank failures Federal Deposit Insurance Corp. Annual amounts, except for 2012, which is a projection based on 23 failures between Jan. 1, 2012, and May 18, 2012.
Industrial production Industrial Production Index, with 2007 level equal to 100, seasonally adjusted.
Economagic.com. Monthly figures shown for January of each year, except for final column, which is April.
Consumer confidence Consumer confidence index, based on a random-sampling, national survey. Courtesy of the Conference Board. Figures for 2008 to 2012 are for January;
final column is for May 2012.
Dow Jones Industrial Average Dow Jones Industrial Average close for the first day of the year after Jan. 1.
Yahoo! Finance. Final column is close for May 31, 2012.
Labor productivity Business output per hour; index with 2005 equal to 100.
Bureau of Labor Statistics . Index is for first quarter of each year shown.
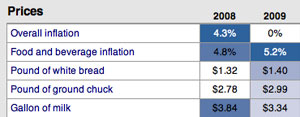
Overall inflation Consumer Price Index for All Urban Consumers (CPI-U) for prior 12 months, not seasonally adjusted. The CPI-U is a measure of the average change over time in the prices paid by urban consumers for a representative variety of consumer goods and services.
Bureau of Labor Statistics. Based on the January figures for each year, except for the final column, which is based on the April 2012 figures.
Food and beverage inflation Consumer Price Index for All Urban Consumers (CPI-U) for food and beverages for prior 12 months, not seasonally adjusted. This measures inflation in the portion of the goods used to calculate CPI-U that are either foods or beverages.
Bureau of Labor Statistics . Based on the January figures for each year, except for the final column, which is based on the April 2012 figures.
White bread, ground chuck, milk, apples, sugar Data courtesy of the
Food Institute, based on government data. Figures are for first quarter of the given year.
Gasoline prices U.S. retail gasoline prices for all grades and all formulations in dollars per gallon.
Energy Information Administration. Data are for the first week of January in each year, except for final column, which is for the third week of May.
Residential natural gas per unit U.S. price of natural gas delivered to residential consumers, in dollars per thousand cubic feet.
Energy Information Administration. Data are for the month of January in each year, except for the final column, which is for February 2012.
Personal saving rate Personal saving as a percentage of disposable personal income.
Bureau of Economic Analysis. 2008-2011 are annual amounts, final column is 1st quarter 2012.
Outstanding credit card debt Revolving consumer credit outstanding, seasonally adjusted.
Federal Reserve Board. January data for all years except for final column, which is March 2012.
Household debt rate Financial obligations as a percentage of disposable personal income; seasonally adjusted. Financial obligations include mortgages, consumer debt, automobile lease payments, rental payments on tenant-occupied property, homeowners’ insurance, and property tax payments.
Federal Reserve Board. Figures are for first quarter for 2008-2011; figure for 2012 is fourth quarter of 2011.
Mortgage rates Contract rate on 30-year, fixed-rate, conventional home mortgage commitments.
Federal Reserve Board. Figures are for January in 2008-2012; final column is for April 2012.
© 2014 • All Rights Reserved • Tampa Bay Times
490 First Avenue South • St. Petersburg, FL 33701 • 727-893-8111
As you can see, the trend is almost identical when viewing all of the economic indicators. The first couple of years for the Obama Administration saw the economy grow worse, but the last several years have seen the economy improve although the numbers have not improved to their original levels. It is also important to understand that the economy that the President inherited was on the descent in response to the financial crisis of 2007 as the ramifications of that crisis had to run its course.
Okay, is the economic performance of President Obama’s Administration as stellar as his camp would want American’s to believe. No, there have been some failures and shortcomings. Is his performance on the economic front as bad and the conservatives want people to believe, of course not. An honest assessment would have to acknowledge that he has made some improvements in key areas.
What was interesting to me was the fact that the people that suffered the most during the lean times were the people that viewed President Obama as their Savior (Blacks and Hispanics, see unemployment numbers). Those that have benefitted most so far are big businesses. Just something to think about. Americans have to be willing to move away from their traditional way of thinking when it comes to politics. First, we have got to take control of our own financial destinies and stop placing our financial futures in the hands of those that are more concerned with protecting their own. Then we must educate ourselves on the matters that affect us.
Just my point of view — it could not be any worse than erroneous madness that is being spewed by both political parties. I hope you enjoyed. ~ Dr. Rick Wallace
Related